How Process Visibility Leads to $50k+ in Savings
Most manufacturing SMEs are losing $50,000 or more each year to inefficiencies they can't see. The problem isn't a lack of effort — it's a lack of visibility. When you map your processes end-to-end, the waste reveals itself, and the savings follow.


The Problem: You're Running Blind
Here's a scenario I see constantly across Australian manufacturing businesses.
The owner knows costs are too high. Margins are tight. Cash flow is unpredictable. But when I ask, "Where exactly is the money going?" — the answer is almost always the same: "We're not sure."
It's not because they're bad operators. It's because they've never had a clear, visual picture of how materials, information, and labour actually flow through their business.
They know their process. They just can't see it.
And when you can't see it, you can't measure it. When you can't measure it, you can't fix it. That's where the money leaks out — silently, consistently, and often for years.
In my experience setting up production lines, commissioning workflows, and conducting time studies across manufacturing operations, I've found that the first and highest-impact step is always the same: make the process visible.
Where the Money Hides
In a typical SME manufacturing operation turning over $5M–$20M per year, the hidden costs tend to cluster around a few key areas. These aren't dramatic failures — they're small, repeated inefficiencies that compound over a year.
| Hidden Cost Area | Typical Annual Waste | How It Stays Hidden |
|---|---|---|
| Excess WIP & inventory holding | $10,000–$25,000 | Treated as "normal" buffer stock |
| Rework and scrap | $8,000–$15,000 | Absorbed into labour costs |
| Operator waiting time | $5,000–$12,000 | Not tracked or measured |
| Unnecessary material movement | $3,000–$8,000 | Baked into floor layout |
| Changeover / setup delays | $5,000–$10,000 | Accepted as "just how it is" |
| Over-processing | $4,000–$10,000 | No standard work defined |
| Total estimated annual waste | $35,000–$80,000 | — |
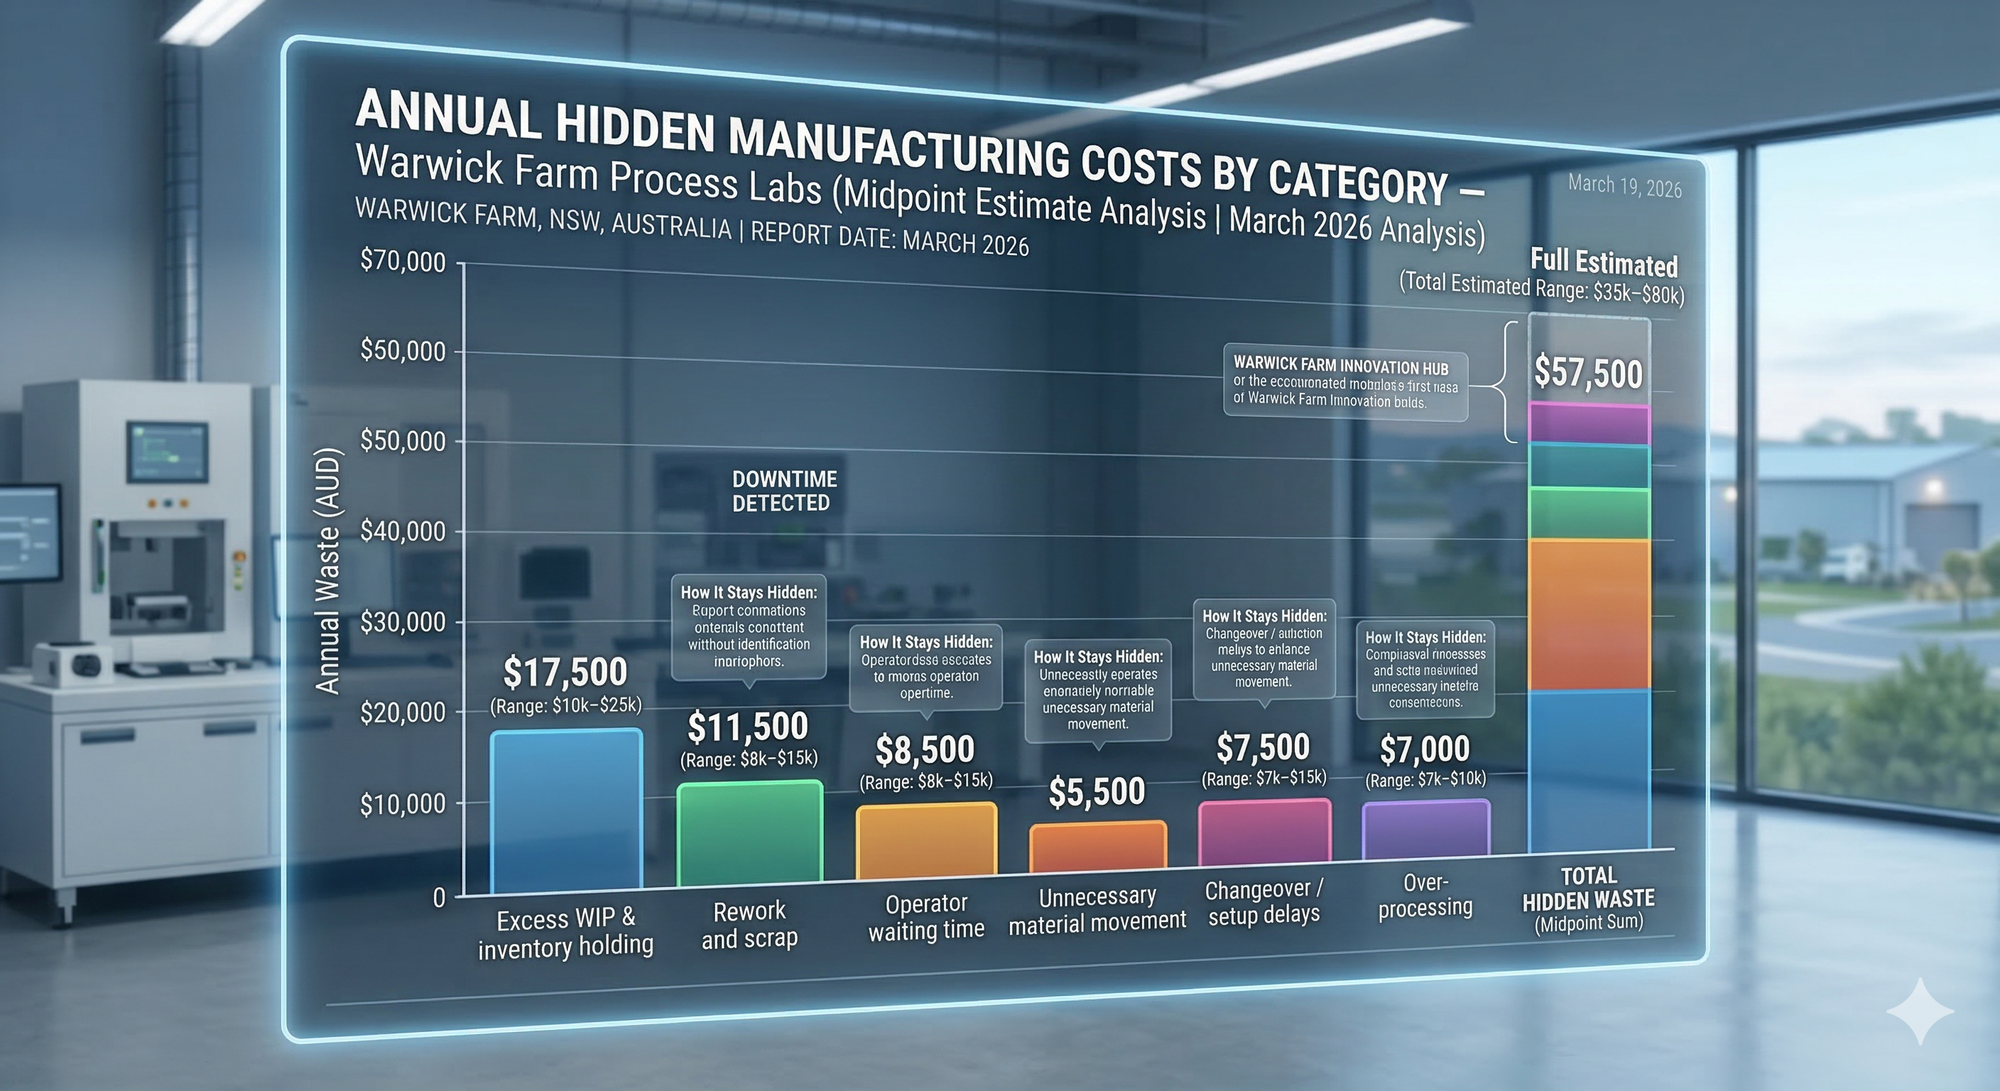
These numbers are conservative. In some operations I've worked with, waste exceeds $100k per year once you account for the knock-on effects: late deliveries, overtime to catch up, quality issues that trigger customer complaints, and the cash tied up in excess inventory.
The real question is: why does it stay hidden?
Because without a structured process map, each of these costs is invisible. They're spread across departments, buried in overhead, or simply accepted as normal.
The Tool That Changes Everything: Value Stream Mapping
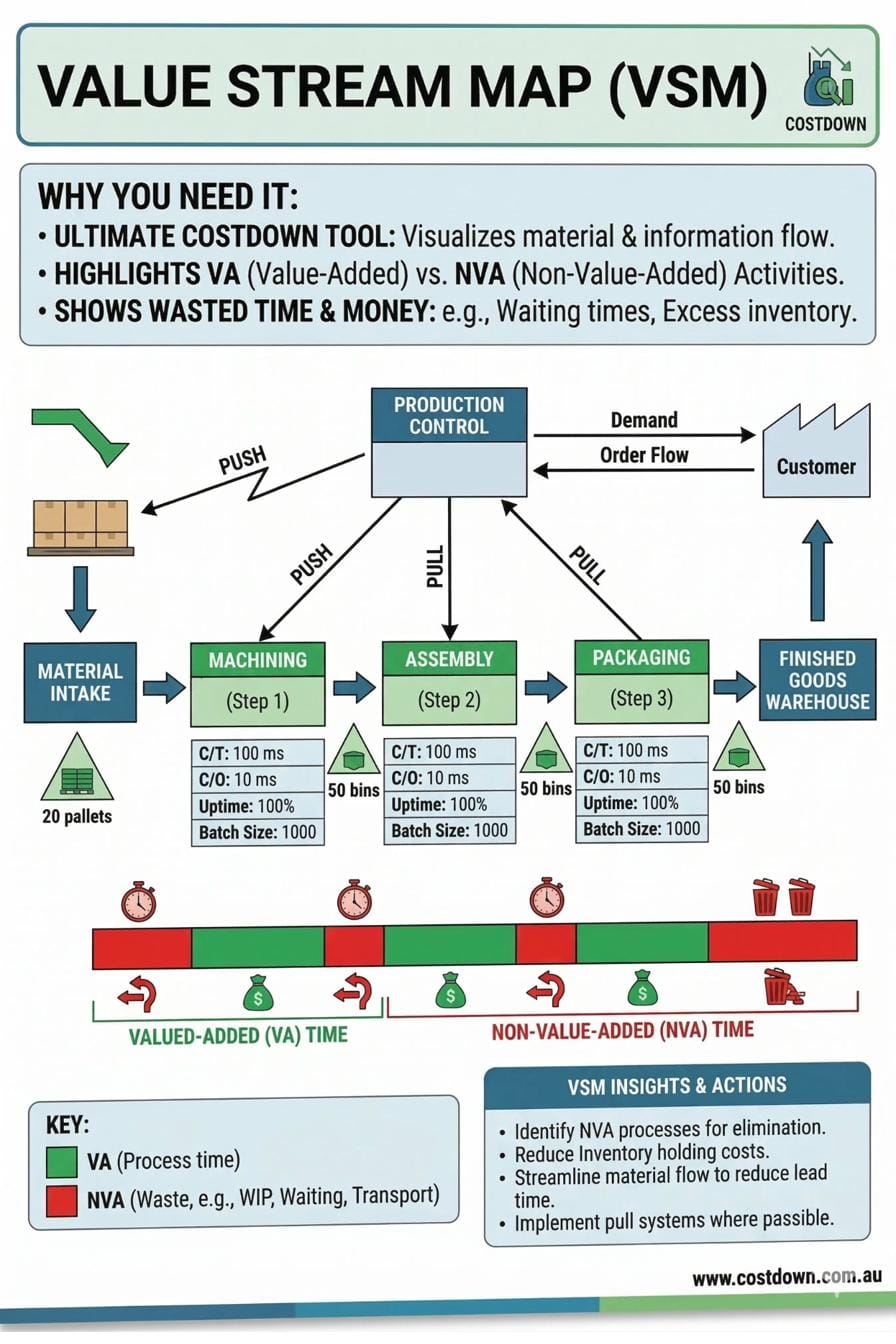
The single most powerful tool I use to make processes visible is the Value Stream Map (VSM).
A VSM is a visual diagram of your entire production flow — from raw material intake to finished goods leaving the dock. It captures material flow, information flow, cycle times, changeover times, inventory levels, and wait times at every step.
Most importantly, it separates value-added (VA) time from non-value-added (NVA) time.
Here's what that looks like in practice:
When I mapped the current state for a louvre production line I set up in Sydney, the results were eye-opening. The process had multiple handoffs, excessive WIP between stations, operator dependency at every step, and no standardised work instructions. The ratio of NVA to VA time was heavily skewed toward waste.
The VSM made all of that visible — on one page, in one picture.
What a VSM Reveals
| VSM Insight | What It Means for Your Business |
|---|---|
| High NVA time between steps | Cash tied up in WIP; orders delayed |
| Large inventory buffers | Holding costs eating your margin |
| Long changeover times | Lost production capacity |
| Push-based scheduling | Overproduction and excess stock |
| No pull signals between steps | Disconnected flow; batching waste |
Real-World Example: Saving $50k on a Production Line
When I was tasked with setting up the Louvre production line, the brief was clear: deliver a full, scalable production line — but under a $50,000 budget.
To do that, I had to see everything before spending anything.
Step 1: Map the Current State
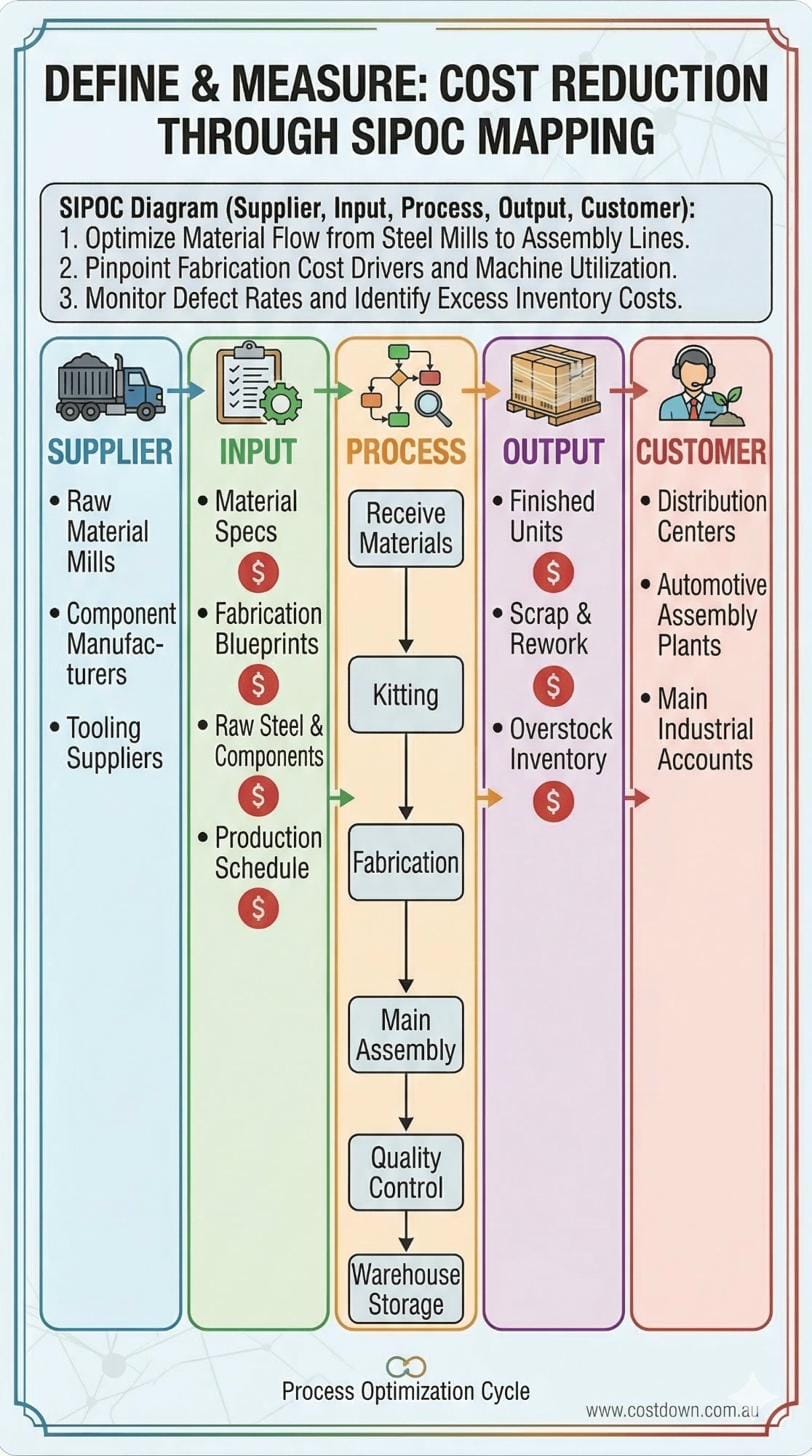
Using a VSM and SIPOC (Supplier–Input–Process–Output–Customer) diagram, I mapped every step of the existing process. This included material intake, kitting, fabrication, assembly, quality control, and warehousing.
The SIPOC gave me a high-level view of cost drivers at each boundary — where money enters the process, where scrap and rework exit, and where overstock accumulates.
Step 2: Identify the Waste
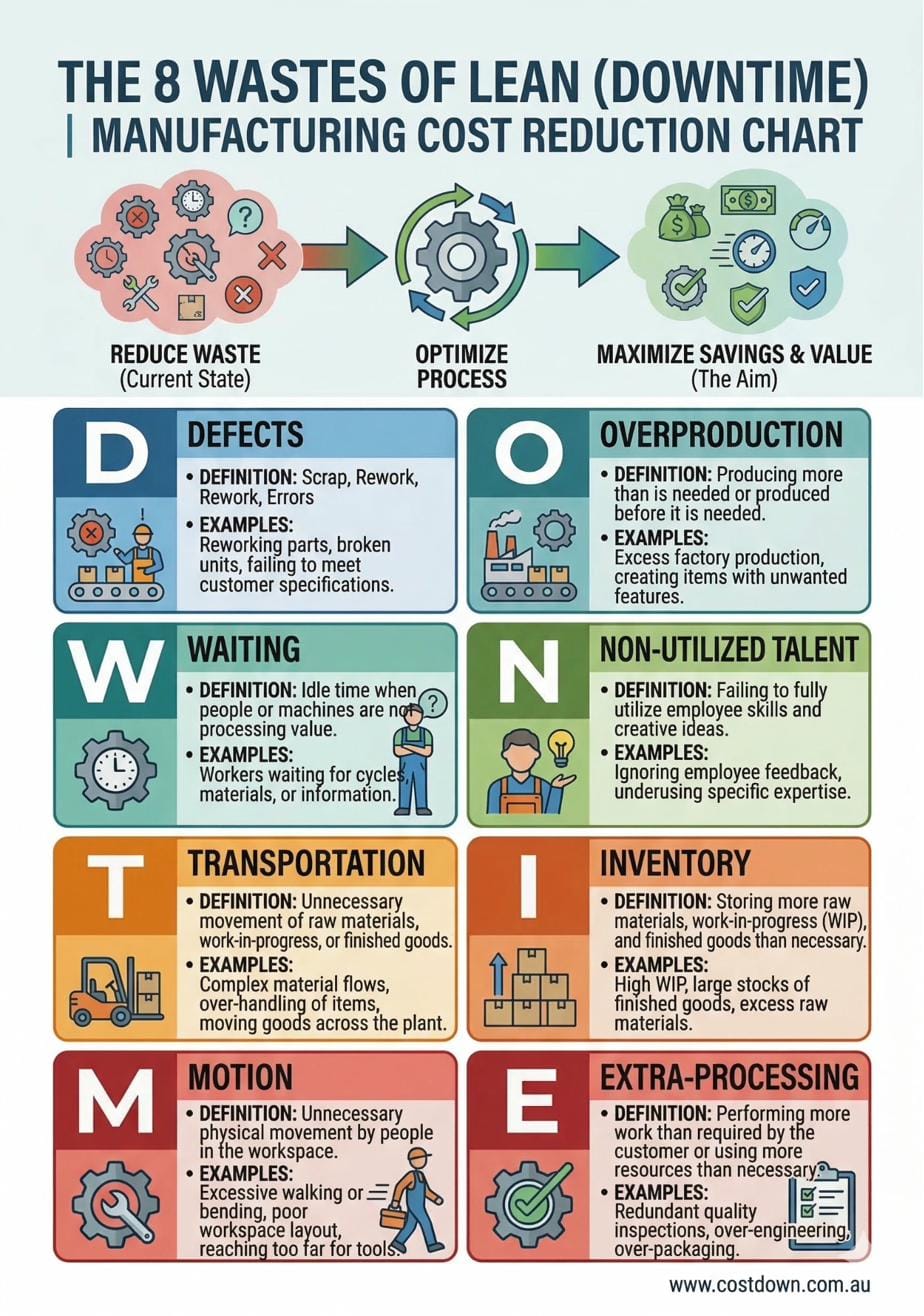
With the process mapped, the waste categories became obvious. Using the 8 Wastes of Lean (DOWNTIME) framework, I tagged every non-value-added activity:
| Waste Type | What We Found |
|---|---|
| Defects | Rework from inconsistent assembly — no jigs or poka-yoke |
| Overproduction | Batching ahead of demand due to push scheduling |
| Waiting | Operators idle between stations; no flow balancing |
| Non-utilised talent | Skilled workers doing manual handling instead of value work |
| Transportation | Excessive forklift movements between disconnected stations |
| Inventory | WIP stacking up between machining and assembly |
| Motion | Operators walking to fetch tools, parts, and paperwork |
| Extra-processing | Over-inspection and manual checks with no standard criteria |
Step 3: Design the Future State
Armed with full visibility, I designed a future-state workflow that eliminated or reduced every identified waste:
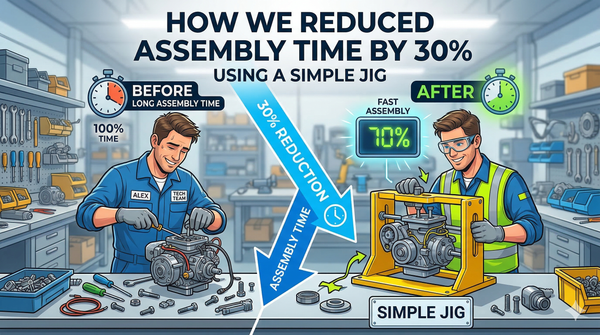
- Low-cost jigs and fixtures replaced expensive capex — error-proofing built directly into the tooling
- Standardised work instructions at every station reduced operator dependency and defects
- Flow-based layout designed around takt time, minimising transport and motion waste
- Kanban pull signals between stations eliminated overproduction and reduced WIP
- ERP routing and BOMs configured to drive process control digitally
- Visual controls on the floor so operators and supervisors could see status at a glance
The Result
| Metric | Before (Estimated) | After |
|---|---|---|
| Total line setup cost | $80k–$120k (industry typical) | < $50k |
| Rework rate | High (no poka-yoke) | Significantly reduced |
| Operator dependency | High | Low — standardised work |
| WIP between stations | Excessive | Controlled via Kanban |
| Cycle time consistency | Variable | Stable and predictable |
| Scalability | Limited | Built for volume growth |
The visibility came first. The savings followed.
Why Most Businesses Skip This Step
If process mapping is so powerful, why don't more manufacturers do it?
Three reasons:
1. They think they already know their process. They do — in their heads. But tribal knowledge isn't the same as documented, measured, visible process flow. What's in the owner's head doesn't help the new operator, the production scheduler, or the accountant trying to understand where margin is disappearing.
2. They jump straight to solutions. I see this constantly. A business buys new equipment, hires more people, or adds overtime — without ever understanding why the process is slow in the first place. Spending money on a problem you haven't diagnosed is the most expensive mistake in manufacturing.
3. They don't have the tools or the time. Running a factory floor is relentless. Finding a week to stop and map the process feels like a luxury. But the cost of not doing it is far higher — it just accumulates quietly.
The Process Visibility Playbook
If you're running a manufacturing SME and you suspect you're losing money to invisible waste, here's how to start:
1. Pick One Product Family
Don't try to map everything. Choose your highest-volume or highest-margin product line. That's where the biggest savings will be.
2. Walk the Floor with a Stopwatch
Conduct a basic time study. Measure cycle times, changeover times, and wait times at every station. Write down what you see — not what you think happens.
3. Draw the Current-State VSM
Map material flow from dock to dock. Include inventory levels, batch sizes, and information flow (how does the schedule reach the floor?). Identify every point where product sits waiting.
4. Calculate the VA Ratio
Add up your total value-added time versus total lead time. In most SMEs, the VA ratio is shockingly low — often below 5%. That means 95% of lead time is waste.
| Metric | How to Calculate | Typical SME Result |
|---|---|---|
| Total lead time | Sum of all process + wait times | 5–15 days |
| Total VA time | Sum of actual processing time only | 2–6 hours |
| VA ratio | (VA time ÷ lead time) × 100 | 1%–5% |
5. Tag the Waste
Use the 8 Wastes (DOWNTIME) framework to categorise every non-value-added activity. Assign a rough cost estimate to each.
6. Design the Future State
Prioritise changes by impact and ease of implementation. Focus on flow, standardisation, and pull — not expensive capital purchases.
The Strategic Takeaway
You can't reduce what you can't see. Process visibility isn't a Lean buzzword — it's the foundation of every dollar you'll ever save in operations. The manufacturers who map their processes first, then act, consistently outperform those who spend first and ask questions later.
In my work setting up production lines, reducing waste by 15%, and delivering scalable systems on tight budgets, the pattern is always the same: visibility creates clarity, clarity creates action, and action creates savings.
For most SMEs, $50,000 in annual savings isn't aspirational — it's sitting on the factory floor right now, waiting to be seen.
Ready to See Where Your Money Is Going?
If you suspect your manufacturing operation is leaking cash but you're not sure where, a short CostDown Audit can make the invisible visible. I'll walk your floor, map your process, and show you exactly where the savings are — with numbers, not guesswork.