How Tolerance Stack-Up Is Quietly Killing Your Assembly Efficiency
Every dimension has a tolerance—but in assemblies, they stack up. Small variations become rework, scrap, and hidden labour cost. This post breaks down the real financial impact of tolerance stack-up—and how to fix it without over-engineering.

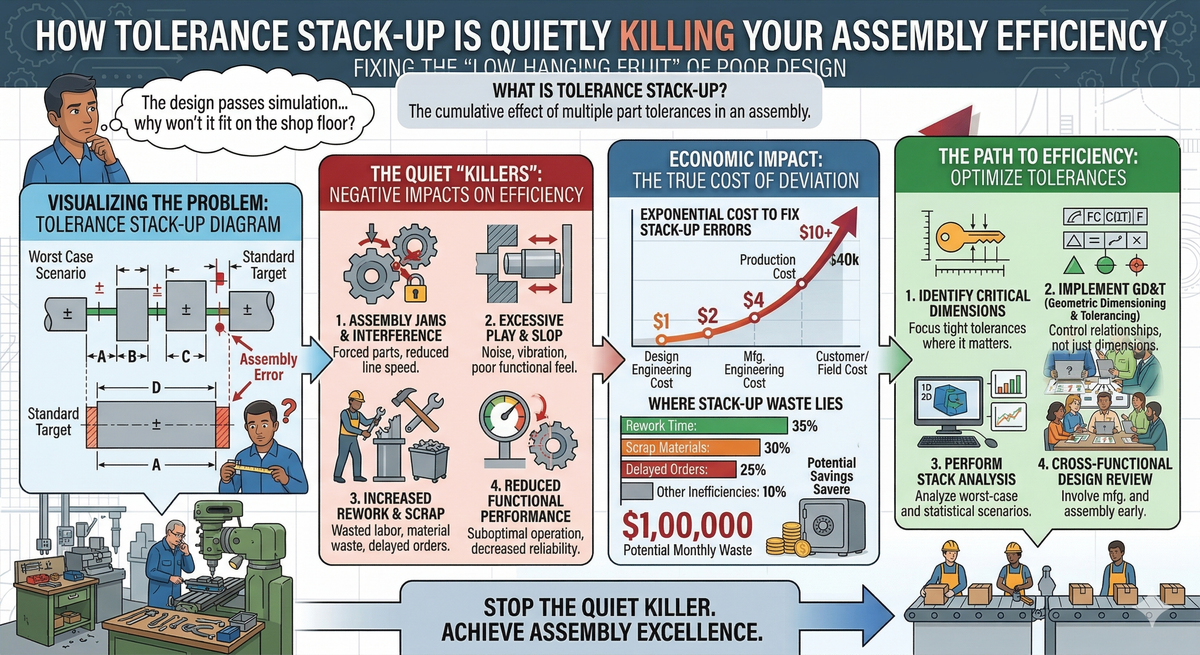
The Problem: Death by a Thousand Tolerances
Here's a scenario I've seen dozens of times across Australian manufacturing workshops:
A fabrication shop produces five components for a sub-assembly. Each part is machined or cut within its specified tolerance — say ±0.5 mm. Every part "passes" quality inspection. But when the assembler tries to put them together, the holes don't line up, the panels gap, or the fasteners bind.
The assembler reaches for a file, a hammer, or a shim. They spend 10–15 extra minutes per unit making it work. Nobody logs it. Nobody flags it. The job gets done. But that hidden rework is burning cash every single shift.
This is tolerance stack-up in action.
Tolerance stack-up (or tolerance accumulation) is what happens when the individual variations allowed on each component add up across a chain of dimensions in an assembly. Even if every single part is within spec, the combined effect of all those tolerances can push the final assembly dimension well outside what's needed for proper fit and function.
Think of it like this: if you have five parts in a chain, each with ±0.5 mm tolerance, the worst-case stack-up is ±2.5 mm. That's a potential 5 mm swing — enough to cause interference, misalignment, or excessive gaps in most precision assemblies.
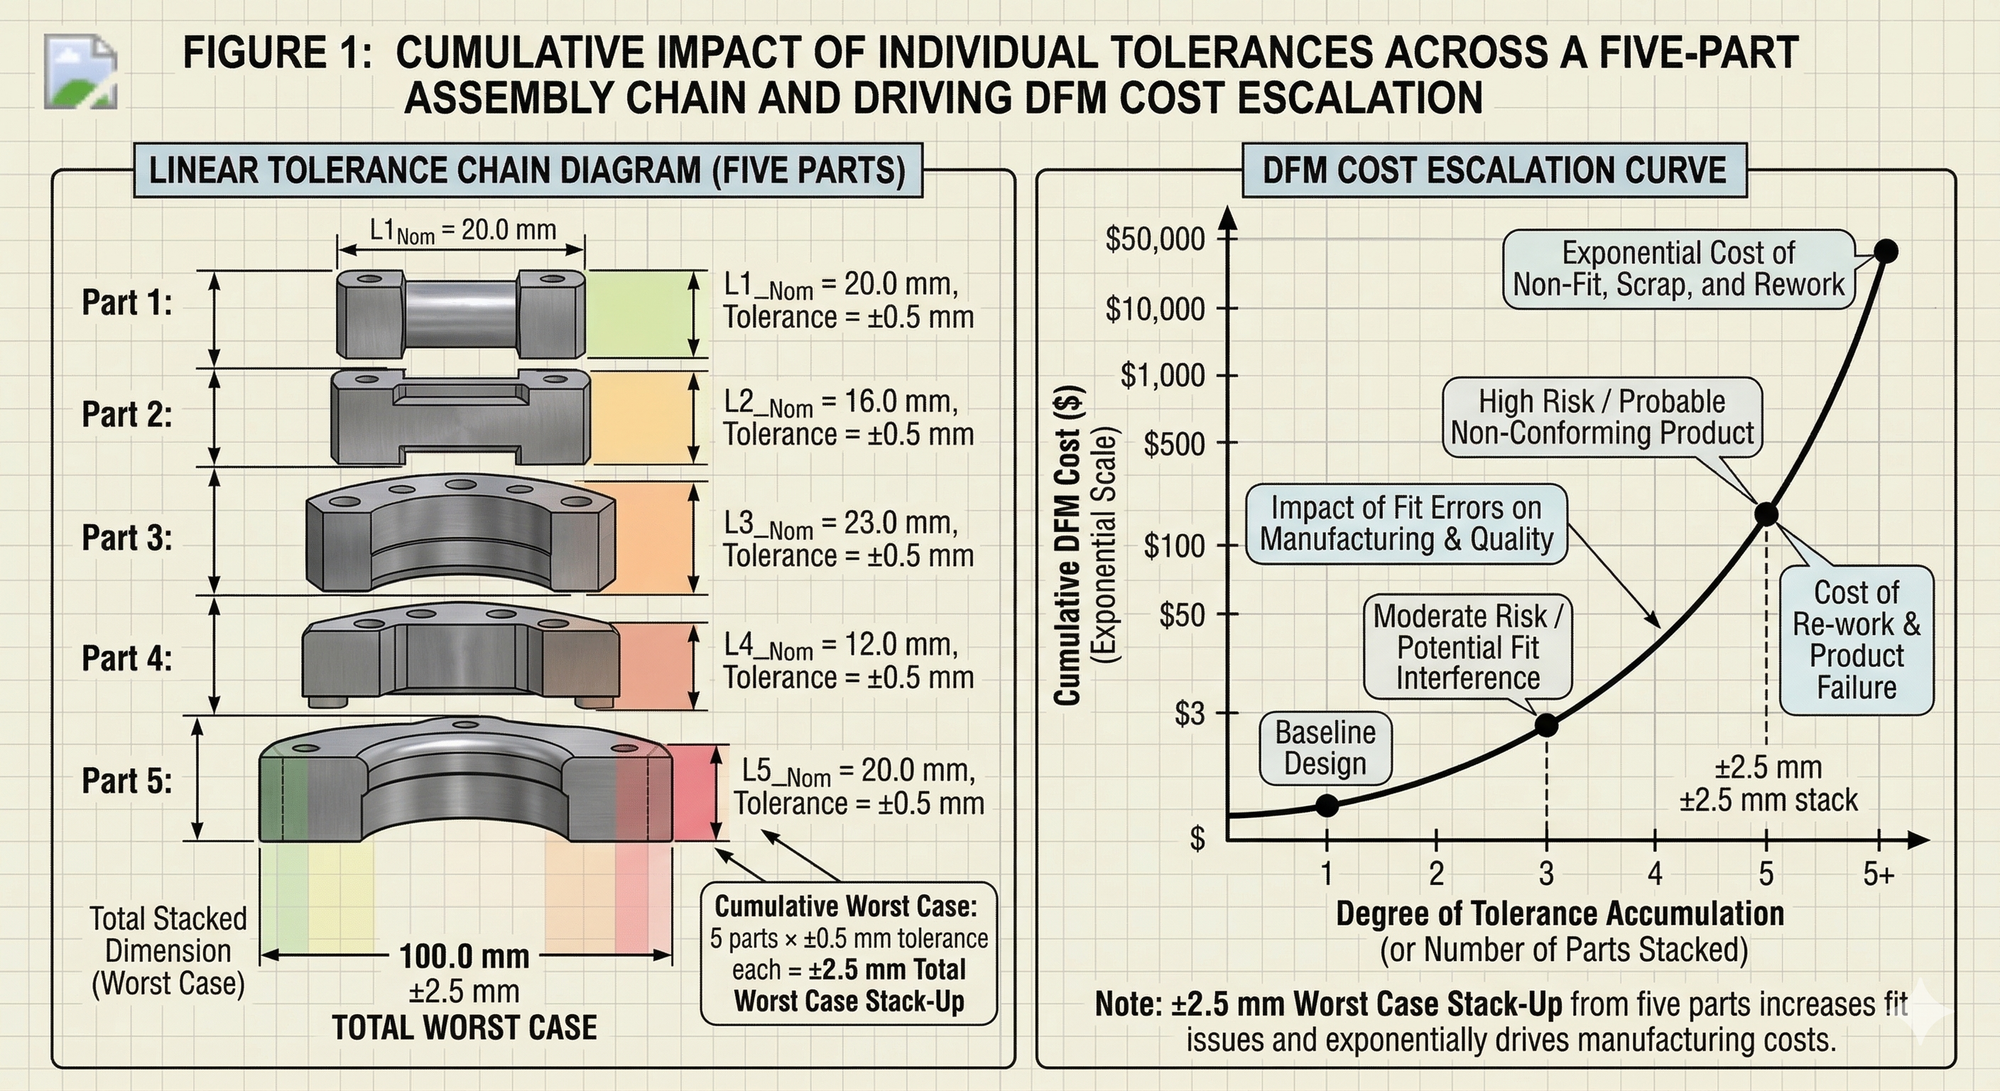
Figure 1: How individual tolerances accumulate across a five-part assembly chain.
Two Methods of Stack-Up Analysis
Before we look at the financial impact, it's important to understand the two primary approaches to tolerance stack-up analysis. The method you choose directly affects your cost.
Worst-Case (Arithmetic) Method
This method simply adds all tolerances together. It assumes every part will simultaneously be at its maximum or minimum limit — the absolute worst scenario.
Formula: T_total = T₁ + T₂ + T₃ + ... + Tₙ
For five parts at ±0.5 mm each: T_total = 0.5 + 0.5 + 0.5 + 0.5 + 0.5 = ±2.5 mm
This method is conservative. It guarantees 100% assembly — but it forces you to either accept wide assembly tolerances or tighten individual part tolerances significantly. Tighter tolerances mean slower machining, more scrap, and higher cost.
Statistical (RSS) Method
The Root Sum of Squares method recognises that it's statistically unlikely all parts will simultaneously be at their worst limits. It gives a more realistic picture of actual assembly variation.
Formula: T_total = √(T₁² + T₂² + T₃² + ... + Tₙ²)
For the same five parts at ±0.5 mm each: T_total = √(5 × 0.25) = √1.25 = ±1.12 mm
That's less than half the worst-case result. It means you can keep part tolerances looser (and cheaper to produce) while still achieving acceptable assembly fit — provided your processes are statistically capable (Cpk ≥ 1.33).
| Method | Part Tolerance | Parts in Chain | Assembly Tolerance | Confidence Level |
|---|---|---|---|---|
| Worst-Case | ±0.5 mm | 5 | ±2.50 mm | 100% |
| Statistical (RSS) | ±0.5 mm | 5 | ±1.12 mm | ~99.73% (3σ) |
The takeaway: choosing the wrong analysis method either costs you money through over-tight tolerances or costs you money through assembly failures. Getting this decision right is a direct lever on your bottom line.
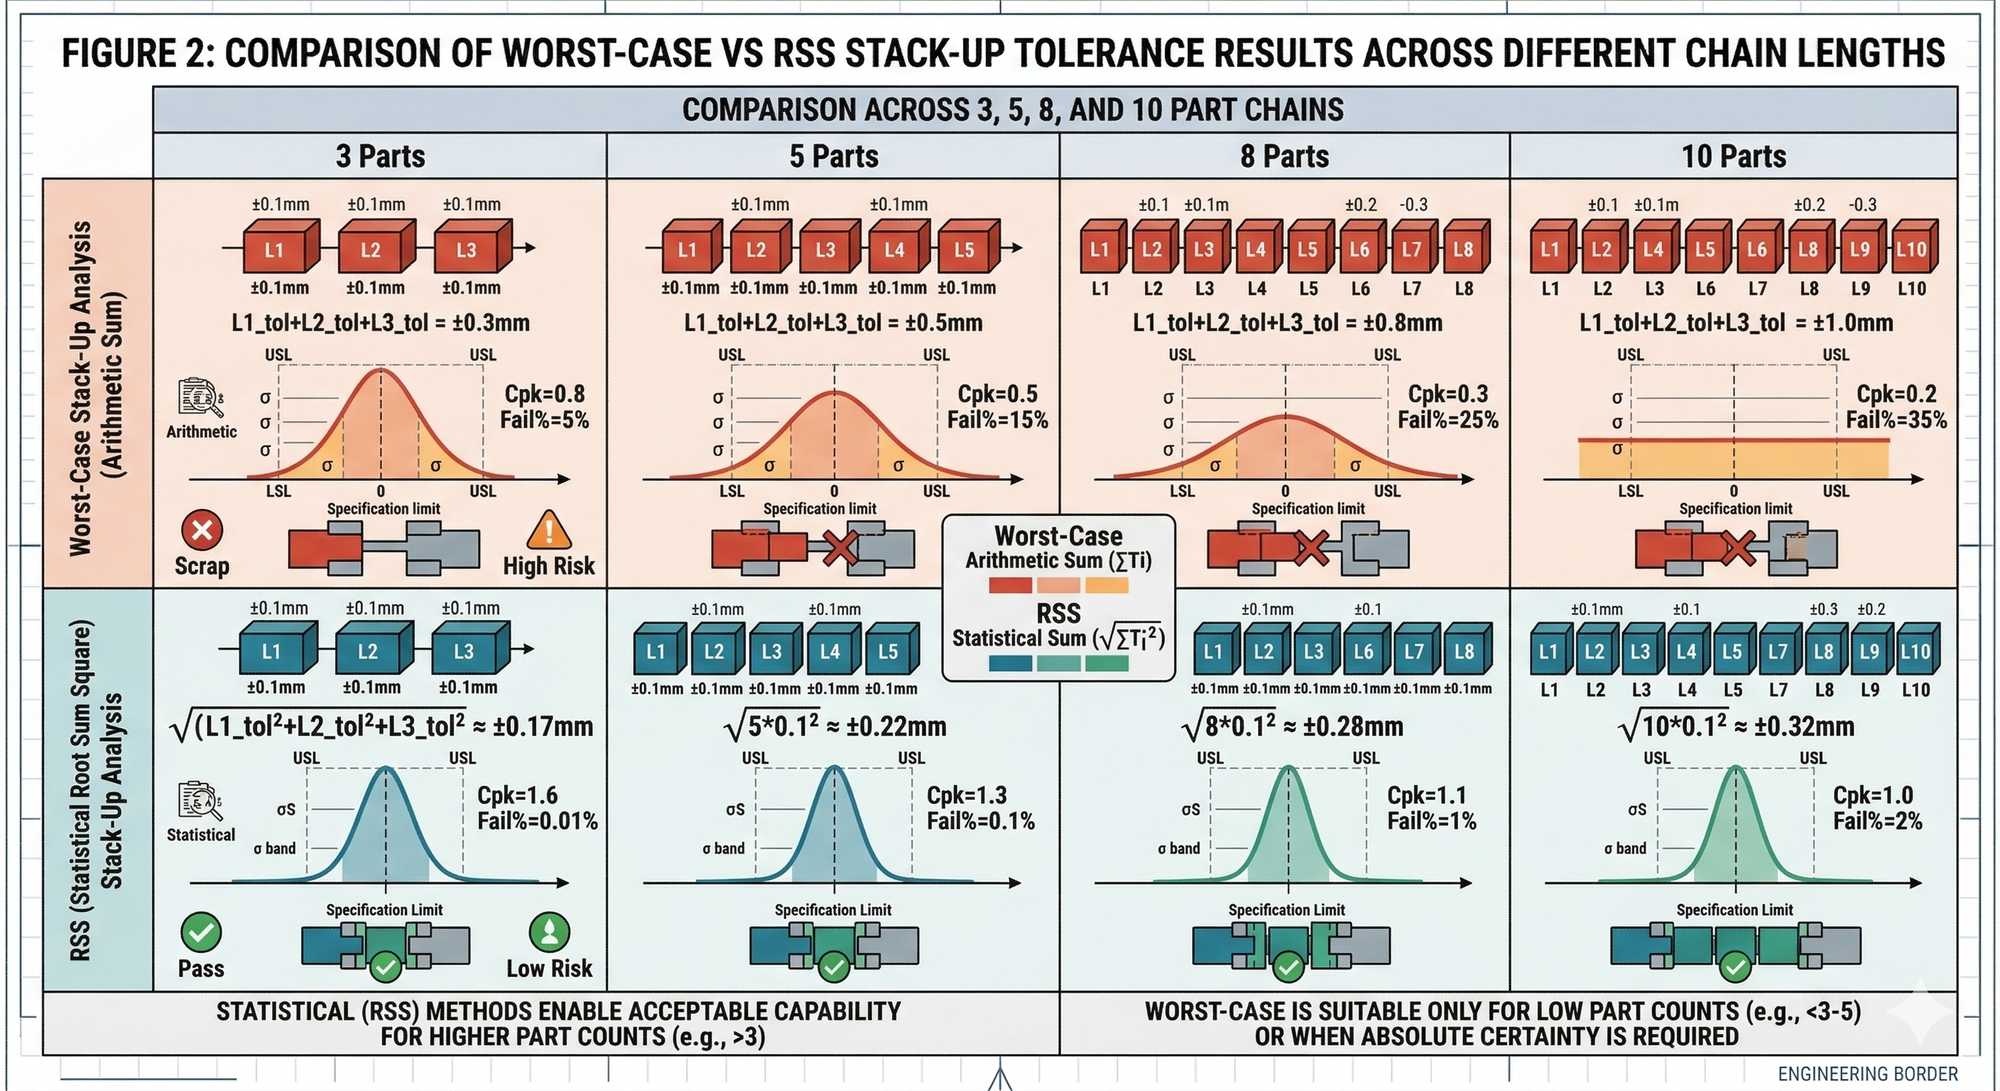
Figure 2: Worst-case vs statistical (RSS) stack-up results across different chain lengths.
The Cost Impact: What Tolerance Stack-Up Actually Costs You
Most small and mid-sized manufacturers never quantify this. Let's put real numbers on it.
Scenario: A Typical Fabricated Sub-Assembly
Assume a fabrication shop producing 50 units per day of a 5-component sub-assembly. Each unit requires an average of 12 minutes of unplanned rework due to tolerance stack-up issues — filing, shimming, re-drilling, forcing fits.
| Cost Factor | Calculation | Annual Cost |
|---|---|---|
| Rework labour | 12 min × 50 units × $55/hr × 250 days | $137,500 |
| Scrap (5% rejection rate) | 50 × 0.05 × $40 material × 250 days | $25,000 |
| Downtime & disruption | 30 min/day lost flow × $200/hr line rate × 250 days | $25,000 |
| Customer returns (1%) | 50 × 0.01 × $150 rework/replace × 250 days | $18,750 |
| Total annual hidden cost | $206,250 |
Over $200,000 per year — on a single sub-assembly — from a problem that most people would describe as "just how it is."
And this doesn't account for the Taguchi Quality Loss Function effect: as dimensions drift further from their nominal target, the cost of poor quality accelerates exponentially. It's not just parts that fail spec that cost you money — parts that are within spec but off-target still degrade assembly quality and increase downstream waste.
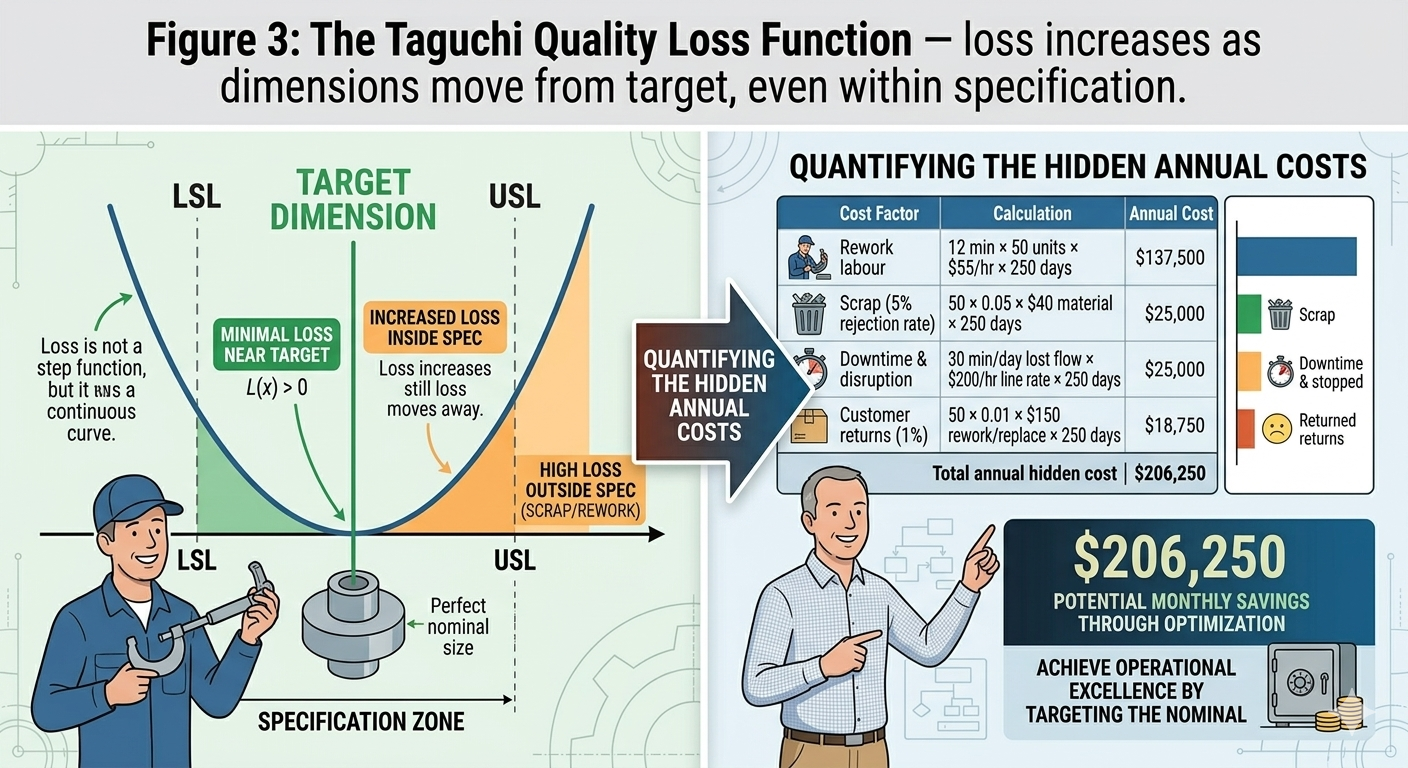
Figure 3: The Taguchi Quality Loss Function — loss increases as dimensions move from target, even within specification.
Why This Happens: The Root Causes
In my experience across toolmaking, product design, and production engineering roles, tolerance stack-up problems almost always trace back to a few common root causes:
1. Drawings specify tolerances in isolation. Each part is dimensioned and toleranced individually, without a stack-up analysis of how it assembles with mating parts. The design engineer never asks: "What happens when all these parts come together at their extremes?"
2. Default tolerances are used without thinking. Standard workshop tolerances (e.g., AS 1100 general tolerances, or ±0.5 mm as a blanket rule) get applied across the board regardless of functional importance. A cosmetic edge gets the same tolerance as a critical locating feature.
3. No GD&T discipline. Geometric Dimensioning and Tolerancing (GD&T) per AS 1100.201 / ISO 1101 allows you to control form, orientation, and position — not just size. Without GD&T, you can have parts that are dimensionally correct but geometrically wrong: bowed, twisted, or out of true position. These geometric errors compound stack-up problems significantly.
4. Process capability isn't matched to tolerance requirements. A tolerance is only as good as the process producing it. If your CNC has a natural process variation (6σ spread) of 0.8 mm and you're calling for ±0.3 mm, your Cpk is below 1.0 — meaning your process physically cannot hold that tolerance consistently. The result is scrap, rework, or worse, bad parts that slip through.
5. Datum structures are inconsistent. Parts are measured and inspected from different reference points than the ones used to locate them in the assembly fixture. This creates phantom variation — everything measures "good" at inspection but doesn't fit at assembly.
The Solution: A Practical Framework for SME Manufacturers
You don't need expensive tolerance analysis software to start fixing this. Here's a step-by-step approach that any Australian manufacturing SME can implement.
Step 1: Identify Your Critical Assemblies
Start with the assemblies that cause the most rework, returns, or assembly complaints. Use your scrap and rework data — or simply ask your assemblers. They know exactly which jobs are a nightmare.
Step 2: Map the Tolerance Chain
For each critical assembly, draw a simple 1D tolerance chain. List every dimension that contributes to the critical fit or gap, and note the tolerance on each one. This can be done on paper or in a spreadsheet.
| Dimension | Nominal (mm) | Tolerance (±mm) | Contributes To |
|---|---|---|---|
| Bracket width | 100.0 | ±0.5 | Gap at assembly |
| Spacer thickness | 10.0 | ±0.3 | Gap at assembly |
| Housing bore depth | 25.0 | ±0.2 | Gap at assembly |
| Shaft shoulder length | 24.0 | ±0.3 | Gap at assembly |
| Fastener washer | 2.0 | ±0.1 | Gap at assembly |
| Assembly gap | Target: 1.0 | WC: ±1.4 / RSS: ±0.67 | — |
Step 3: Run Both Analyses
Calculate worst-case and RSS stack-ups. If the worst-case result exceeds your assembly tolerance, you have a confirmed stack-up problem. If the RSS result is acceptable, you may be able to rely on statistical methods — but only if your processes are capable (Cpk ≥ 1.33 on every dimension in the chain).
Step 4: Apply Smart Tolerance Allocation
Don't just tighten everything. That's expensive. Instead:
- Tighten only the dimensions with the largest contribution to the stack-up (use a sensitivity analysis — which tolerance contributes most to the total?)
- Loosen tolerances on non-critical features to reduce machining cost
- Apply GD&T where form and position matter — use position tolerances with datum references to control where the feature actually is, not just how big it is
- Add locating features (dowel pins, datum pads, interlocking geometry) to reduce the number of dimensions in the stack-up chain
Step 5: Match Process Capability to Tolerance
Before you sign off on any tolerance, confirm your process can hold it. Run a short capability study (30+ samples) on the critical dimensions. You need Cpk ≥ 1.33 minimum — ideally 1.67 for new product launches (per PPAP requirements in automotive-standard work).
| Cpk Value | Meaning | Defect Rate (DPMO) | Action Required |
|---|---|---|---|
| < 1.00 | Not capable | > 66,800 | Process improvement or tolerance change required |
| 1.00–1.33 | Marginally capable | 66,800–6,210 | Monitor closely, improve if possible |
| 1.33–1.67 | Capable | 6,210–600 | Acceptable for most manufacturing |
| > 1.67 | Highly capable | < 600 | Excellent — meets PPAP launch targets |
Step 6: Design Assembly Aids (Poka-Yoke)
Where tolerance stack-up can't be fully eliminated through tighter specs, design the assembly process to compensate:
- Self-locating features — chamfers, tapers, and guides that pull parts into alignment
- Adjustable joints — slotted holes instead of fixed holes where alignment needs to be tuned
- Assembly fixtures and jigs — purpose-built tooling that holds parts in their correct relative position during fastening
- Go/No-Go gauges — simple checking tools at the point of assembly, not just at final inspection
This is exactly the approach I used when designing the Ventus Louvre production line — purpose-built jigs with error-proofing built directly into the fixtures, reducing assembly variation without relying on impossibly tight part tolerances.
Step 7: Close the Loop with SPC
Once your tolerances and processes are aligned, implement Statistical Process Control on the critical dimensions. Monitor Cpk over time. When you see it drifting, you catch the problem before it reaches the assembly bench — not after.
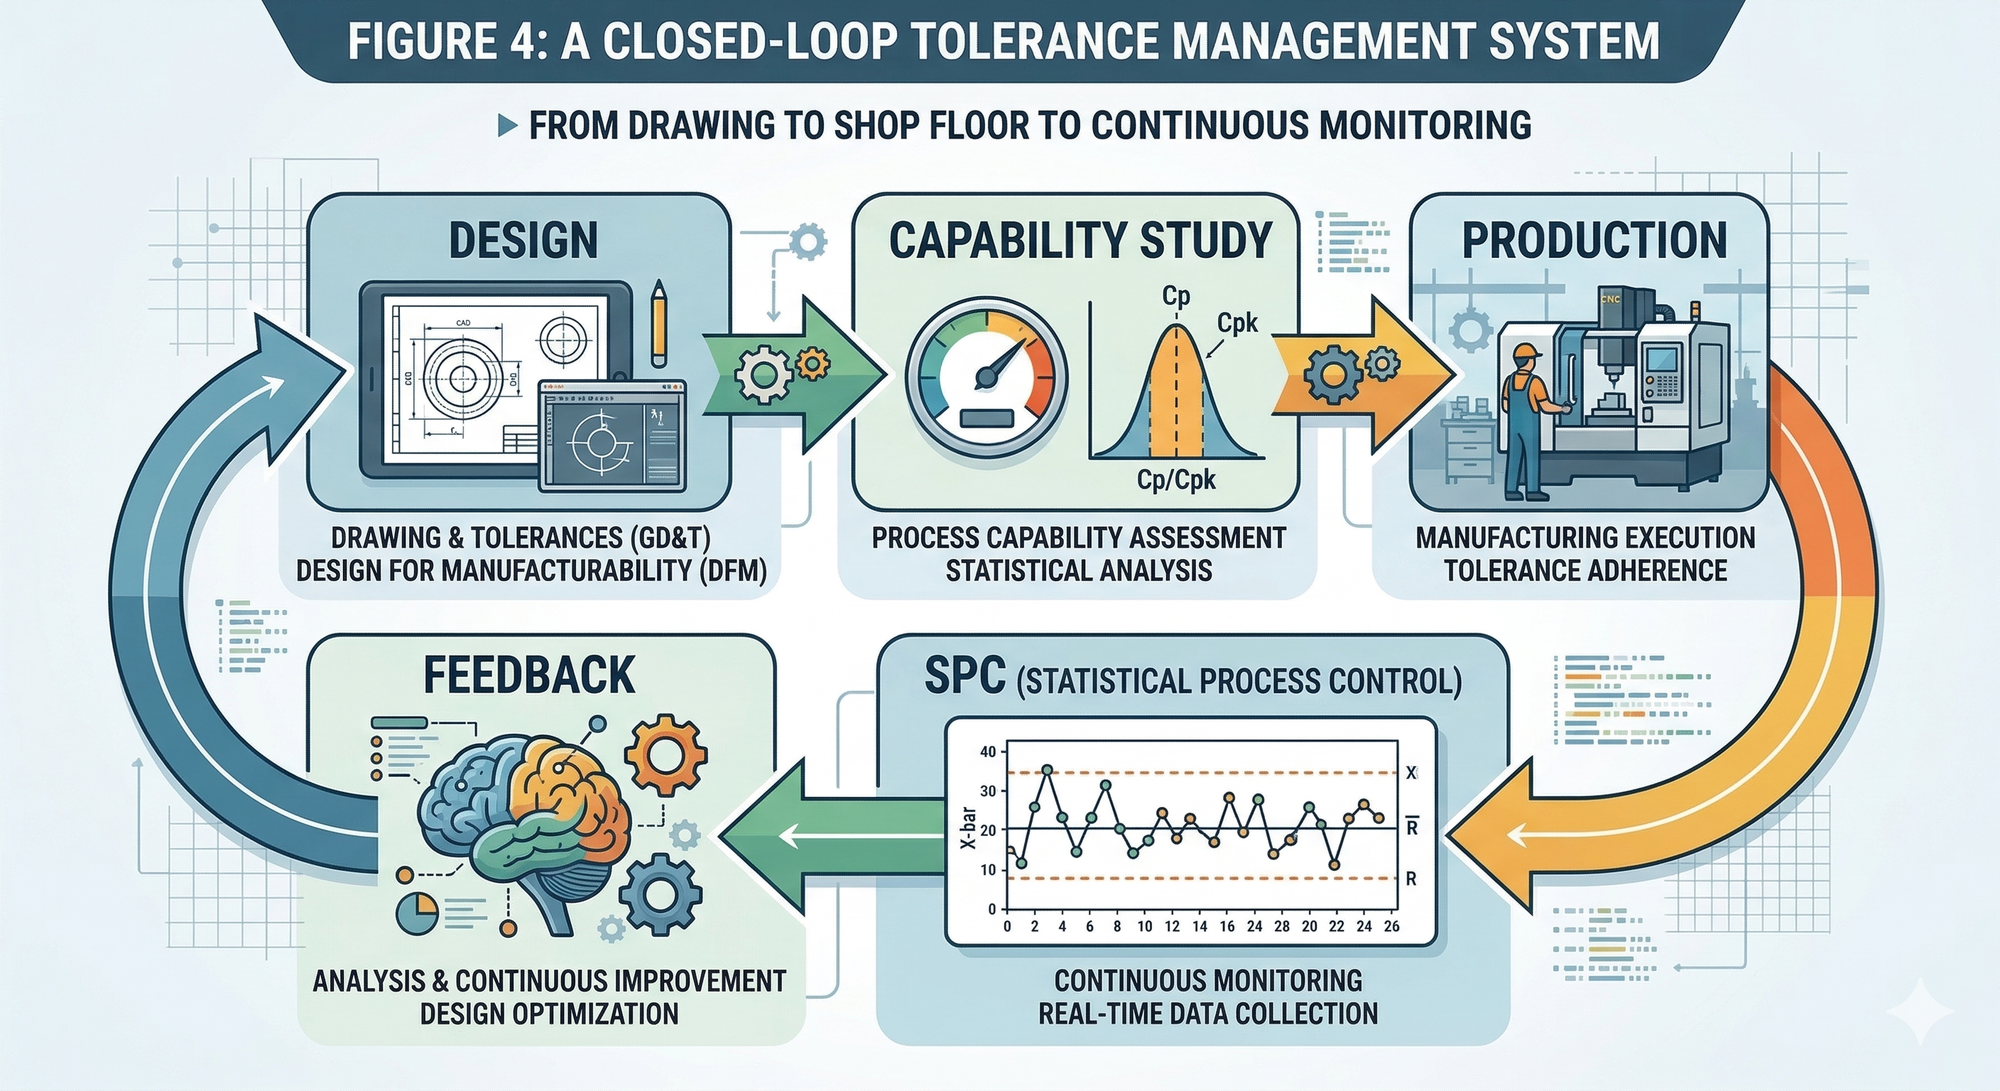
Figure 4: A closed-loop tolerance management system — from drawing to shop floor to continuous monitoring.
Real-World Impact: What Good Tolerance Management Delivers
When I work with manufacturing clients on tolerance-related assembly problems, the typical results include:
| Improvement Area | Typical Result |
|---|---|
| Assembly rework time | Reduced 40–60% |
| Scrap rate on mating parts | Reduced 30–50% |
| Assembly cycle time | Reduced 15–25% |
| Customer returns (fit issues) | Reduced 50–70% |
| Operator frustration & turnover | Measurably improved |
On a $2M revenue fabrication operation, addressing tolerance stack-up on just two or three critical assemblies can free up $100k–$250k per year in recovered labour, reduced scrap, and improved throughput. That's not revenue — that's money going straight to your bottom line.
Key Takeaway
Tolerance stack-up is one of the most common — and most overlooked — sources of cost in small and mid-sized manufacturing. Every minute your assemblers spend filing, shimming, and forcing parts together is money you're burning. The fix doesn't require expensive software or radical redesign. It requires engineering discipline: mapping your tolerance chains, matching your process capability to your specs, and designing assemblies that go together right the first time.
The businesses that control their tolerances control their costs.
Ready to Find the Tolerance Leaks in Your Operation?
If your assembly team is spending too much time making parts fit — or if rework and scrap are eating into your margins — there's likely a tolerance stack-up issue hiding in your drawings.
I offer a short CostDown Audit specifically designed for small and mid-sized manufacturers. We'll walk your critical assemblies, map the tolerance chains, and identify the highest-impact fixes — usually within a single site visit.