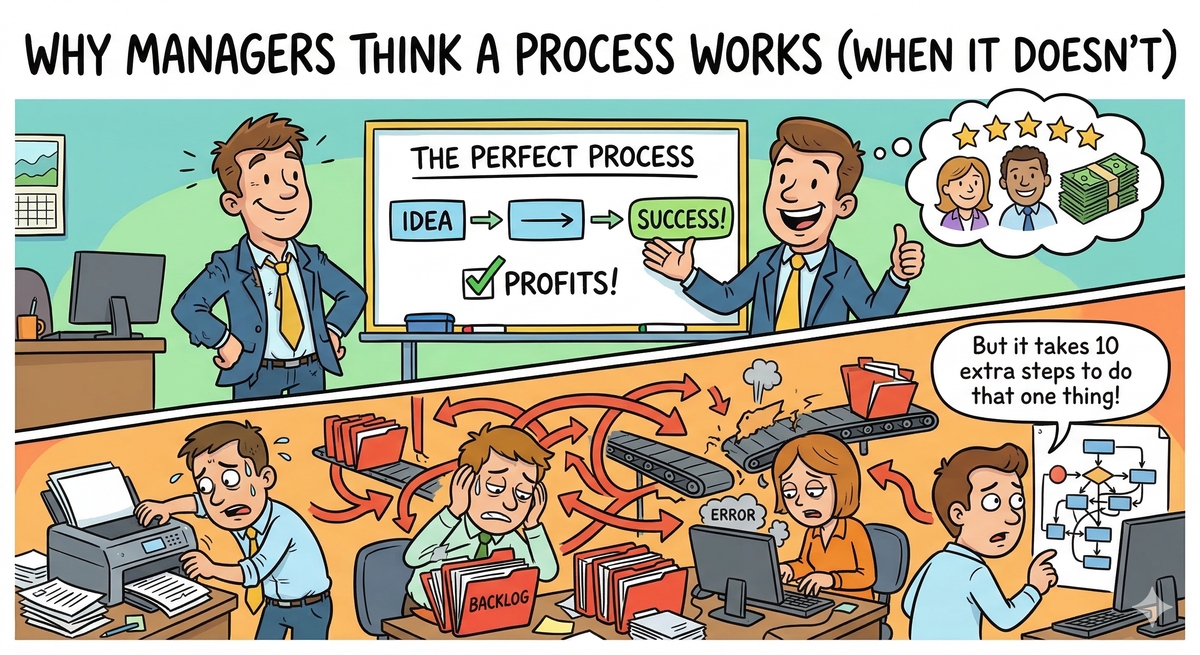
Why Managers Think a Process Works When It Doesn’t
Many managers think processes are fine if products get made—but 'working' isn’t the same as 'efficient.' I’ll show how one shopfloor study uncovered $87,000 in hidden waste and turned it into real savings

The Problem: "It Works" Is the Most Expensive Assumption in Manufacturing
I've spent 25 years on shopfloors — from toolmaking apprenticeships to commissioning full production lines — and I hear the same thing from managers every month:
"The process works. We hit our numbers."
Here's the issue: hitting numbers doesn't mean you're not bleeding cash.
When I was setting up the Louvre production line in Sydney, the existing assembly workflow was "working." Parts were being assembled, orders shipped, customers happy enough. But when I actually stood on the floor and watched — with a video camera, not a spreadsheet — the reality told a completely different story.
What I saw:
- Operators walking 14 metres between stations to fetch parts that should have been at arm's reach
- The same part being picked up, put down, and repositioned three times before assembly
- One operator waiting 4–6 minutes per cycle while another station caught up
- Rework happening at the end of the line because errors weren't caught at the source
None of this showed up in the ERP system. None of it appeared on the production report. The process "worked" — but it was full of hidden cost.
Why managers miss it
The reasons are predictable and human:
- They manage from reports, not from the floor. ERP tells you what was produced, not how painfully it was produced.
- They confuse output with efficiency. If 100 units ship, the process must be fine — right?
- They normalise workarounds. When operators have been doing something a certain way for years, it stops looking like a problem.
- They don't measure the right things. Cycle time gets tracked. Walking time, waiting time, double-handling? Almost never.
The Cost: What "It Works" Actually Costs You
Let's put real numbers on it. Here's what I measured during a time study on a mid-sized assembly line — a line the manager said was "running well."
| Waste Type | Time Per Cycle | Cycles/Day | Daily Waste | Annual Cost (@ $45/hr) |
|---|---|---|---|---|
| Unnecessary walking | 2.5 min | 80 | 200 min | $17,550 |
| Double-handling parts | 1.8 min | 80 | 144 min | $12,636 |
| Operator waiting (imbalanced line) | 4.2 min | 80 | 336 min | $29,484 |
| Rework from uncaught errors | 3.1 min | 80 | 248 min | $21,762 |
| Total hidden waste | 11.6 min | 80 | 928 min | $81,432 |
That's over $81,000 a year in waste on a single line — and the manager thought the process was fine.
Add scrap costs, overtime driven by inefficiency, and the knock-on delays to other jobs, and you're easily looking at $87,000–$100,000 per year in avoidable cost. On a business running $1.5M EBITDA, that's roughly 6% of your profit walking out the door.
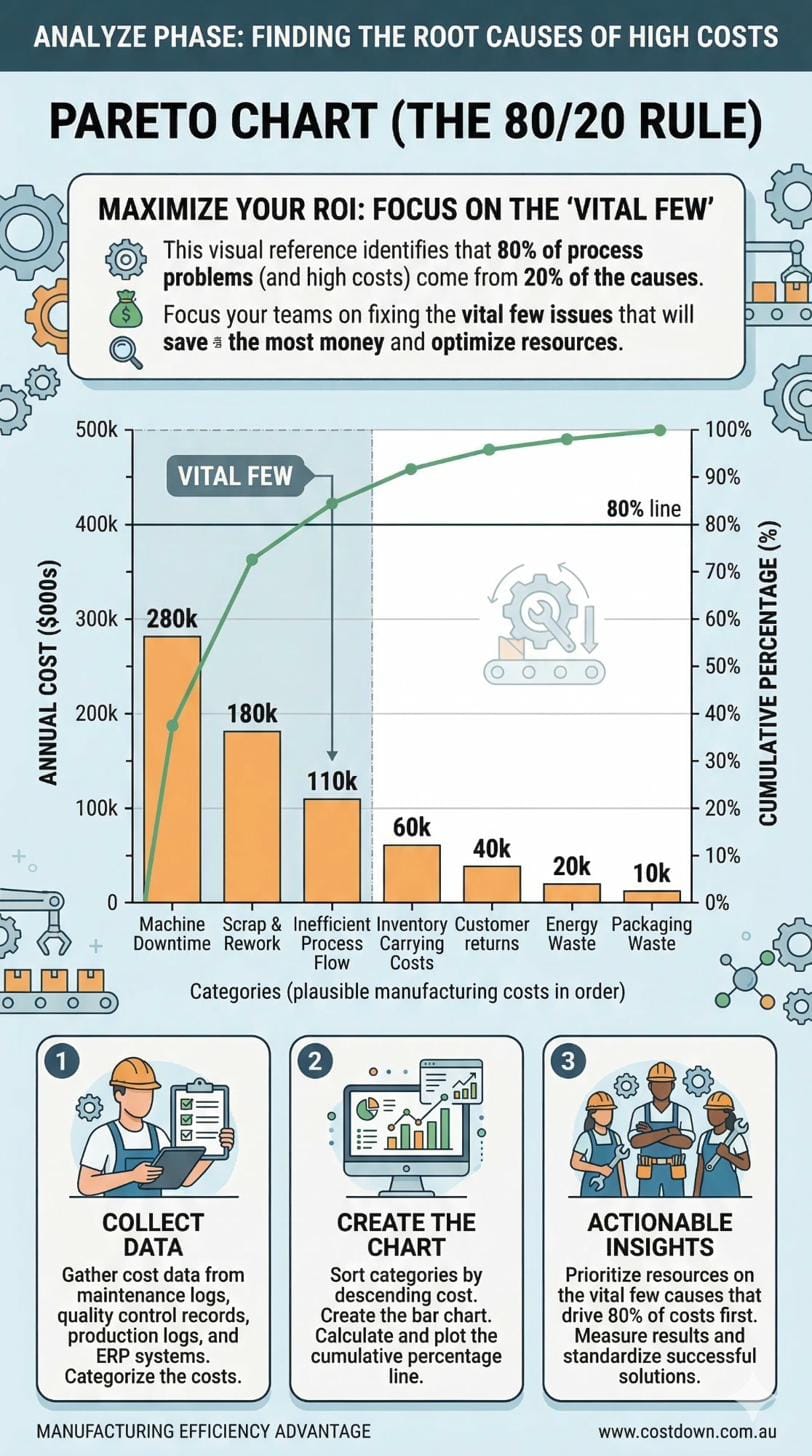
Chart: Annual cost of hidden shopfloor waste by category. Walking, waiting, handling, and rework add up fast.
The Shopfloor Reality: What Actually Happens vs. What You Think Happens
Here's the gap I see on almost every shopfloor I walk into:
| What the Manager Sees | What's Actually Happening |
|---|---|
| "Parts are being assembled" | Operator walks 14m round-trip for every part |
| "We ship on time" | Two operators stay back 45 min/day to cover rework |
| "Scrap rate is acceptable" | Errors caught at final inspection, not at source |
| "The team knows what to do" | No standardised work — each operator does it differently |
| "We've always done it this way" | $81k/year in waste is baked into the process |
This is the fundamental problem: the process produces output, so nobody questions the process.
But output is not the same as efficiency. And in manufacturing, the gap between the two is where your money disappears.
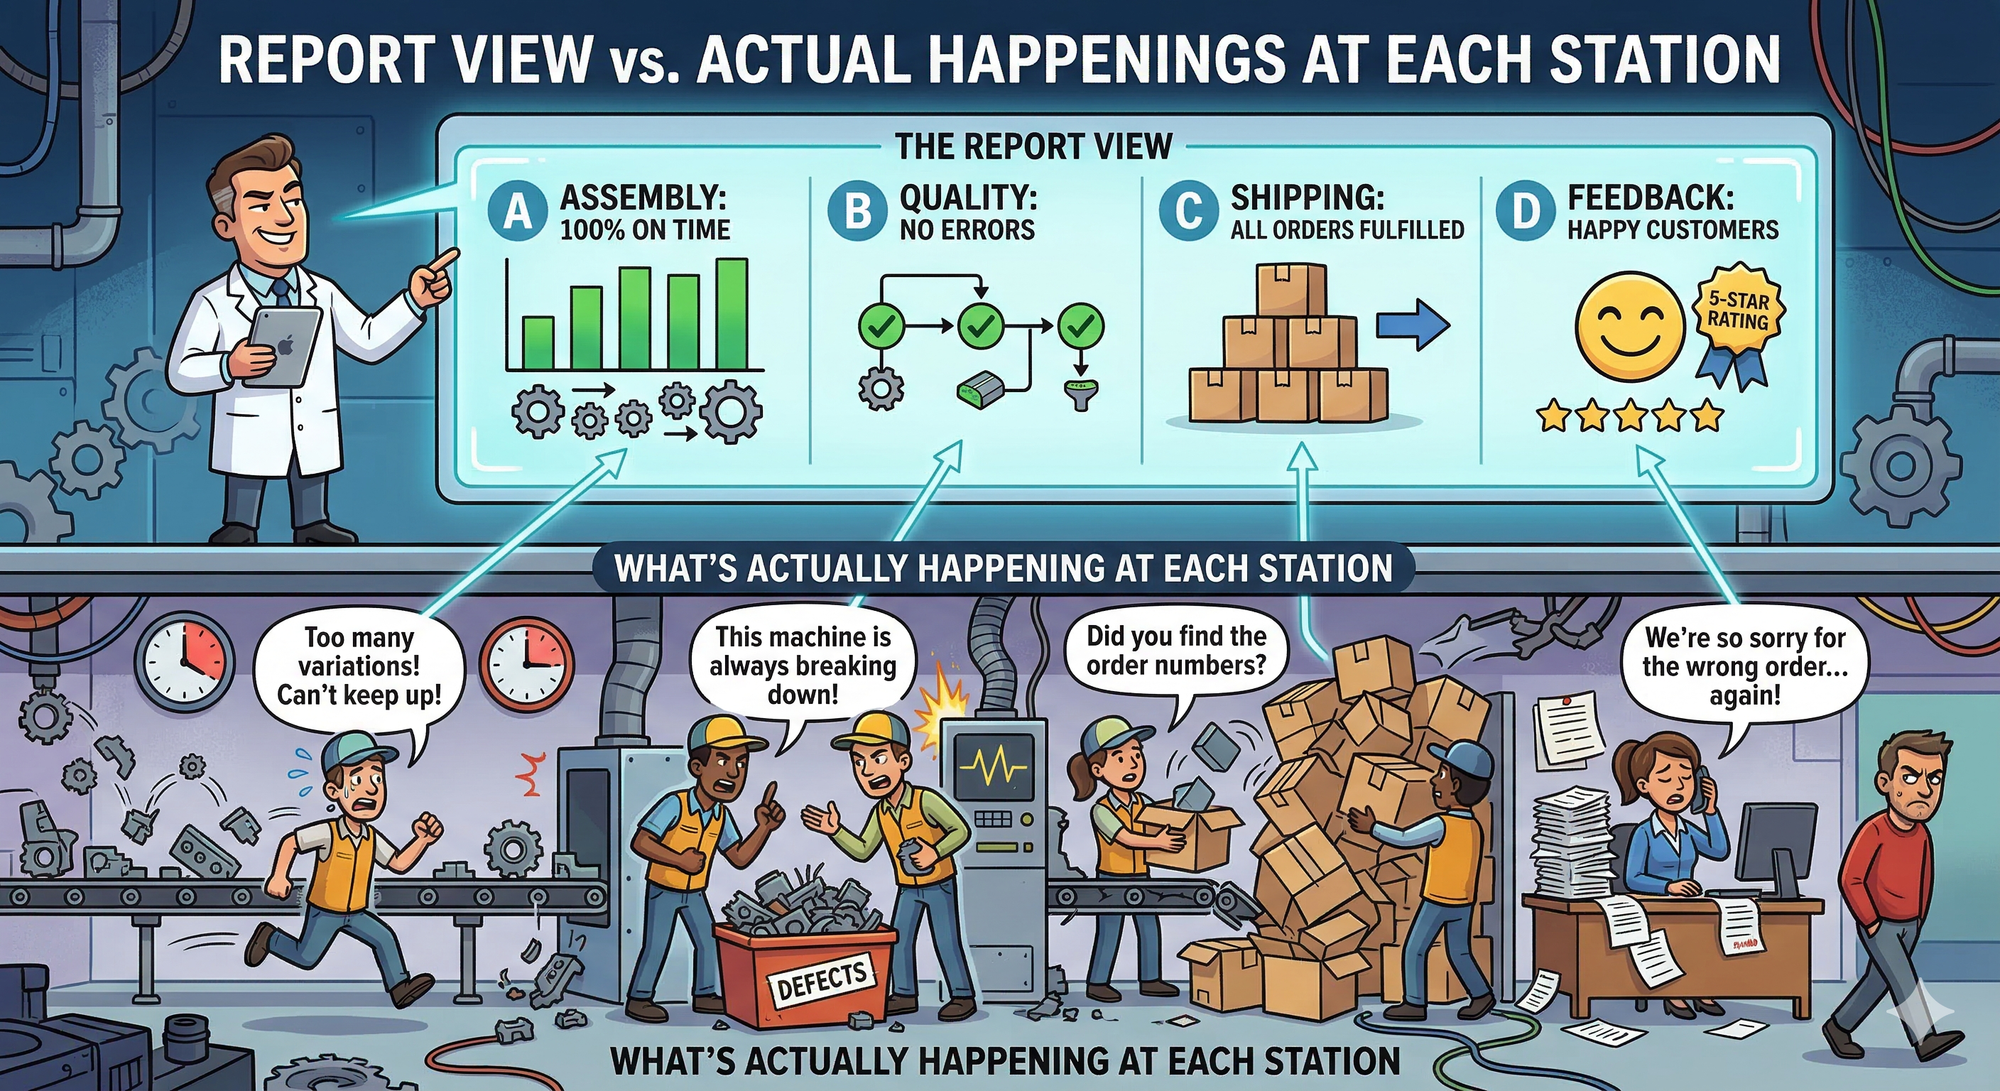
Illustration: The difference between the report view and what's actually happening at each station.
The Solution: How to Turn Shopfloor Problems Into Measurable Cost Savings
When I set up the Louvre Line, I used a straightforward approach — no expensive consultants' frameworks, no six-month programmes. Just practical engineering thinking applied to the workflow.
Step 1: Go to the floor and watch
Put down the laptop. Stand at the line for two hours. Watch where operators walk, wait, and struggle. Time everything.
I use simple time studies — a GoPro camera, a clipboard, and the discipline to record what actually happens rather than what should happen. This is where you'll find the 11.6 minutes of waste per cycle that doesn't appear in any report.
What to measure:
- Cycle time per station (actual, not theoretical)
- Walking distance per cycle
- Wait time between stations
- Touch count — how many times is a part picked up before it's done?
- Rework frequency and where it's caught
Step 2: Map the current state — honestly
Use a Value Stream Map (VSM) to document the actual flow, including every delay, queue, and workaround. Not the idealised version — the real one.
When I mapped the Louvre line before redesign, the current-state VSM showed that only 34% of the total lead time was value-added work. The rest was movement, waiting, and correction.
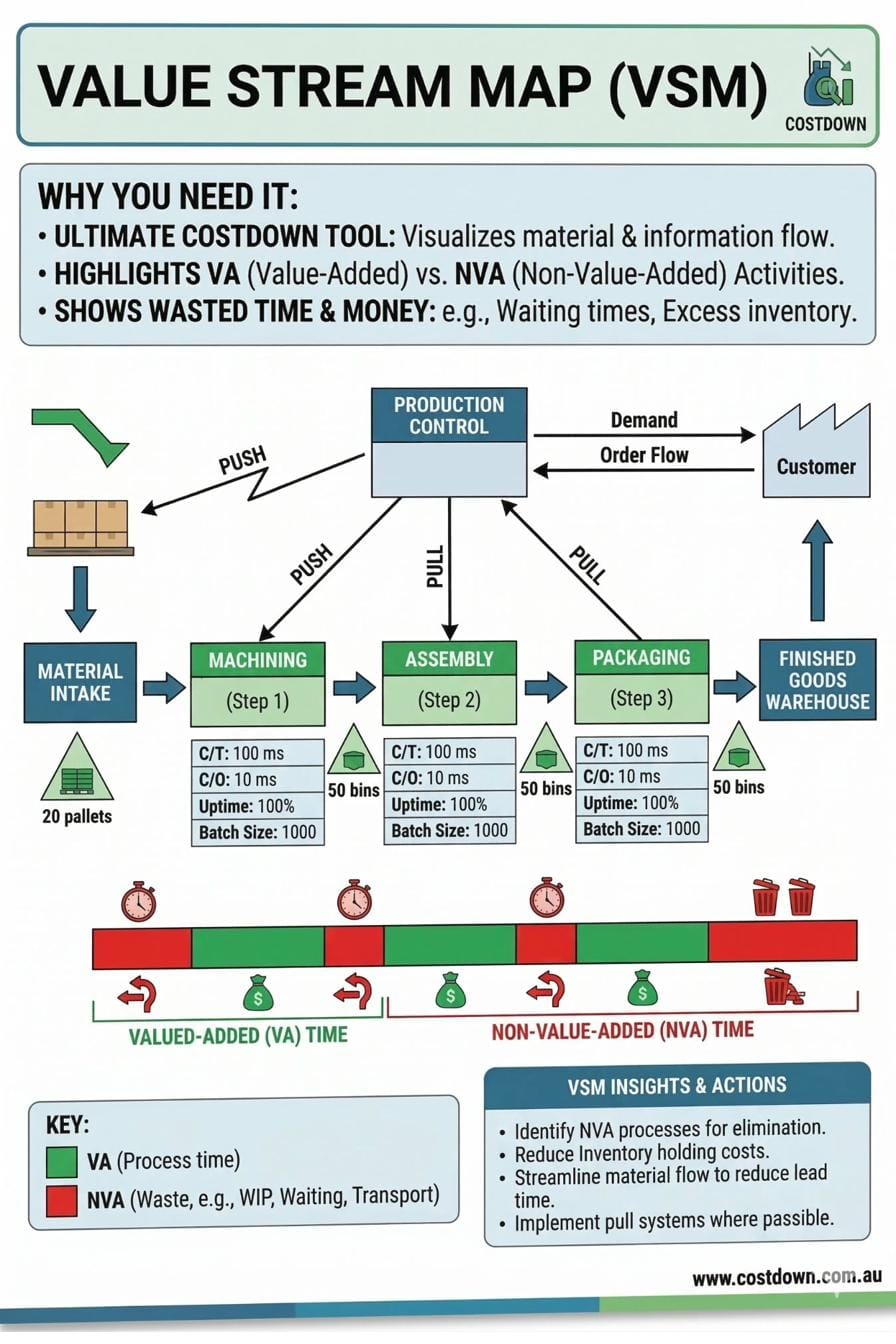
Diagram: Current-state VSM showing non-value-added time vs. future-state target after redesign.
Step 3: Fix the biggest cost items first
Don't try to fix everything at once. Use a Pareto approach — tackle the 20% of causes driving 80% of the cost.
On the Louvre line, the top three fixes were:
| Fix | What Changed | Time Saved/Cycle | Annual Saving |
|---|---|---|---|
| Relocated parts to point-of-use | Eliminated 14m walking | 2.5 min | $17,550 |
| Rebalanced line to takt time | Reduced operator wait | 4.2 min | $29,484 |
| Added poka-yoke to fixtures | Caught errors at source | 3.1 min | $21,762 |
| Total from top 3 fixes | 9.8 min | $68,796 |
Three changes. No major capital spend. $68,796 recovered per year.
Step 4: Standardise the improved process
This is where most improvement efforts fail. You fix the problem, but six weeks later, operators drift back to old habits because nothing was documented.
I implemented standardised work instructions at every station — clear, visual, and built into the workflow. Combined with ERP routing updates and visual controls on the line, the improvements stuck.
Step 5: Measure again and sustain
After changes went live on the Louvre line, I ran follow-up time studies at 30, 60, and 90 days. The results held — and in some areas improved further as operators refined their new routines.
| Metric | Before | After | Improvement |
|---|---|---|---|
| Cycle time (total) | 18.4 min | 8.6 min | 53% reduction |
| Walking distance/cycle | 14 m | 2.8 m | 80% reduction |
| Rework rate | 8.2% | 1.4% | 83% reduction |
| Labour cost per unit | $13.80 | $6.45 | 53% reduction |
| Annual waste cost | $81,432 | $12,636 | $68,796 saved |
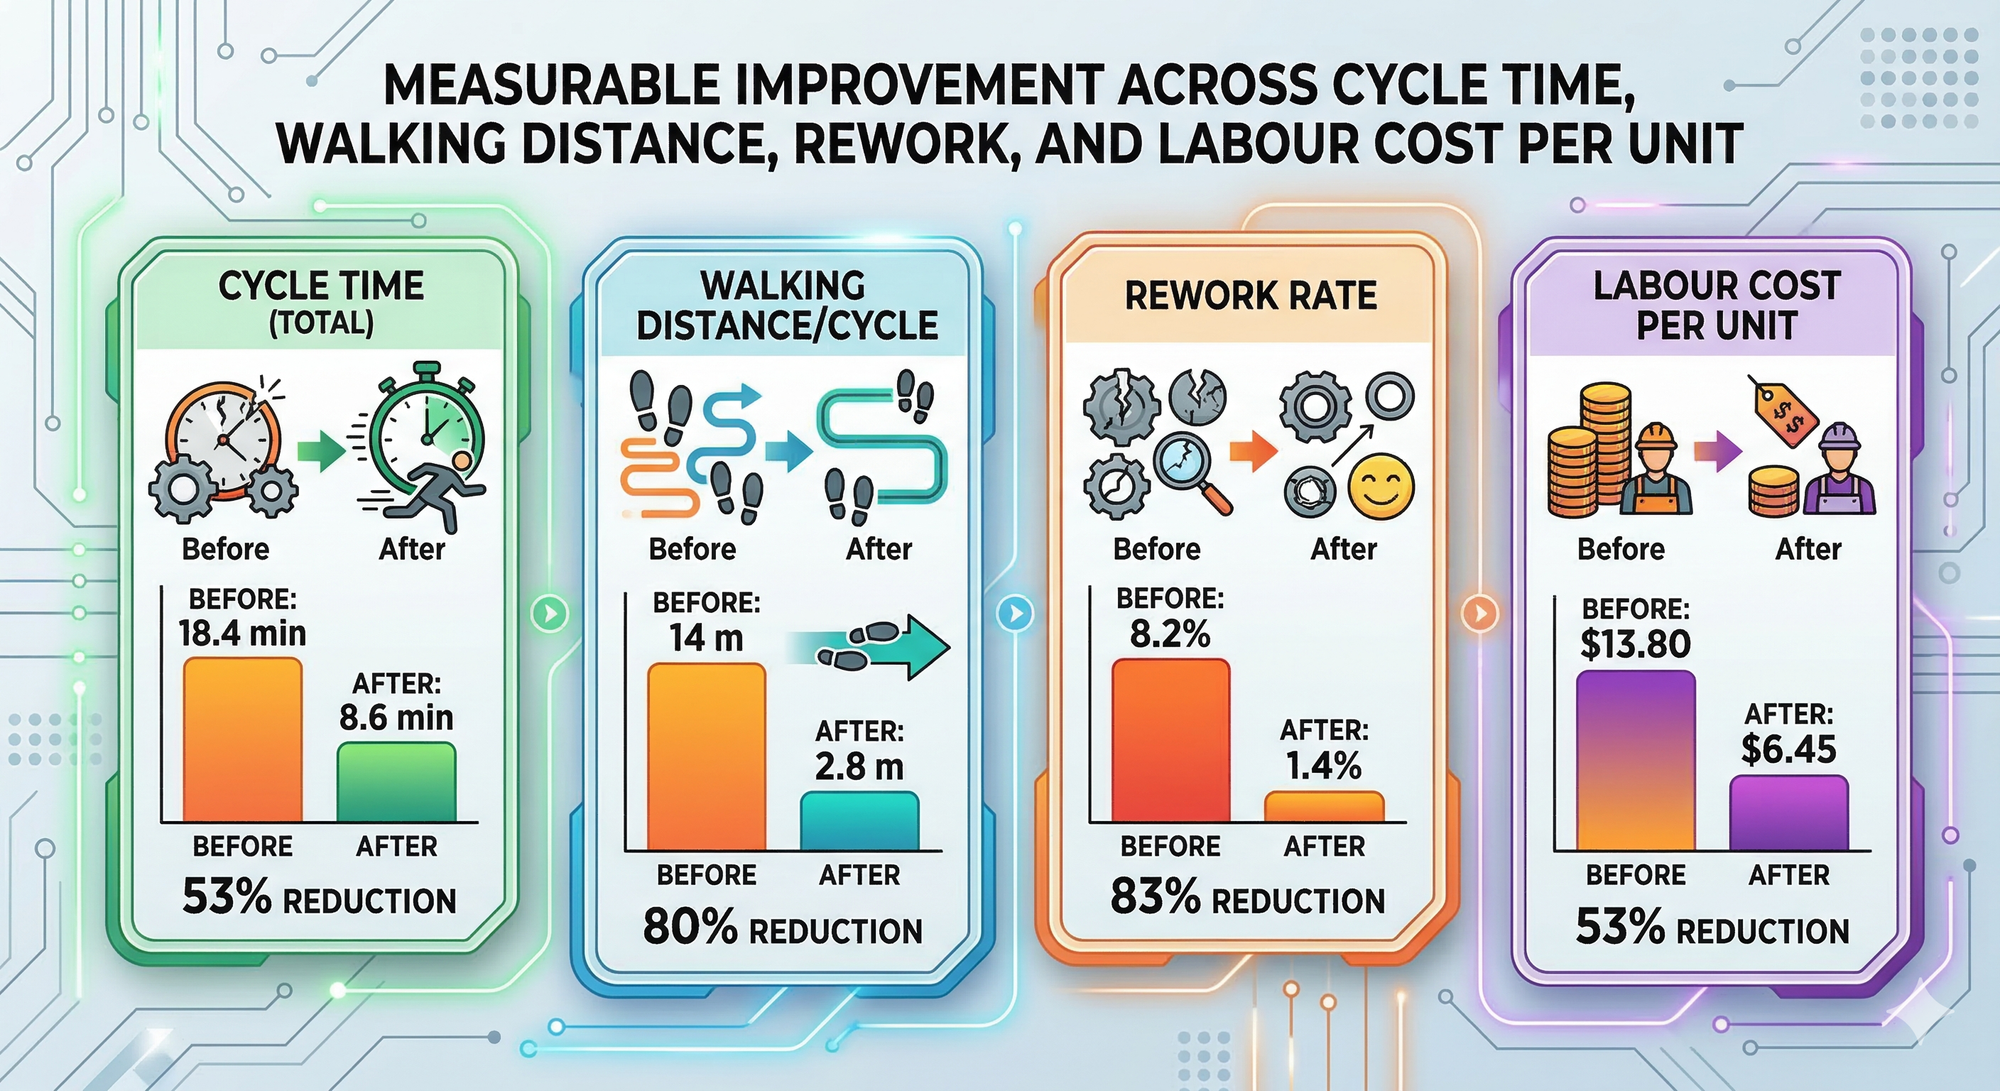
Chart: Measurable improvement across cycle time, walking distance, rework, and labour cost per unit.
The DMAIC Framework: Structured Problem-Solving for the Shopfloor
The approach I've described follows the DMAIC (Define, Measure, Analyse, Improve, Control) framework from Lean Six Sigma — but applied with shopfloor common sense, not academic theory.
| Phase | What You Do | Shopfloor Translation |
|---|---|---|
| Define | Identify the problem | "This line is costing more than it should" |
| Measure | Collect real data | Stand on the floor with a GoPro camera |
| Analyse | Find root causes | Fishbone diagram, Pareto analysis |
| Improve | Implement fixes | Relocate parts, rebalance line, add poka-yoke |
| Control | Sustain the gains | Standardised work, visual controls, follow-up audits |
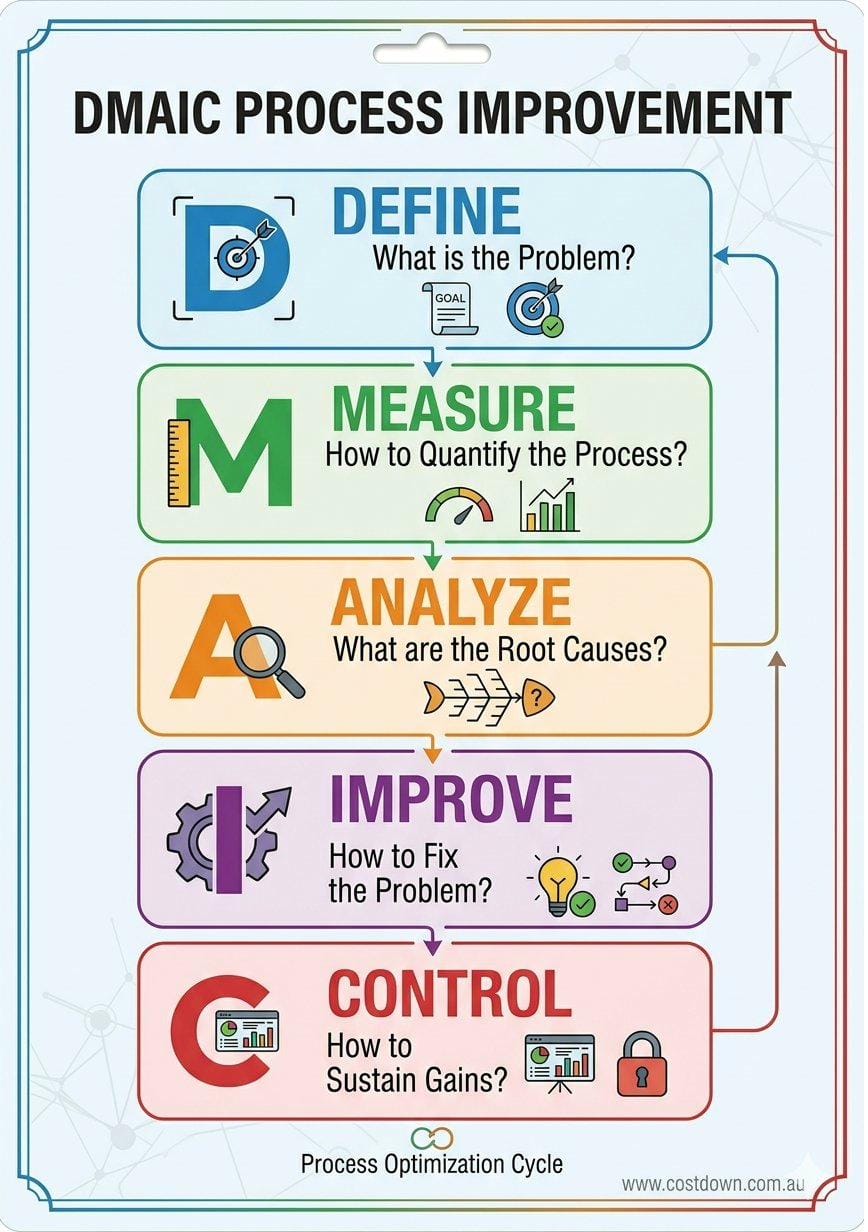
The DMAIC cycle: a structured approach to turning shopfloor problems into sustained cost savings.
The key is that every phase connects back to money. If you can't quantify the problem in dollars, you can't justify the fix. And if you can't measure the result, you don't know if you've actually improved anything.
Takeaway
A process that "works" is not the same as a process that works efficiently. The gap between the two is where manufacturers lose tens of thousands of dollars every year — often without realising it.
The fix isn't complicated: go to the floor, measure what's actually happening, and turn what you find into a cost number. Once you can see the waste in dollars, the path to fixing it becomes obvious.
Three things to do this week:
- Pick your busiest line and stand there for two hours with a stopwatch or camera
- Measure walking time, waiting time, and rework per cycle
- Multiply the waste by your labour rate — then decide if "it works" is good enough
Ready to Find the Hidden Cost in Your Process?
Most manufacturers I work with are surprised by what a simple shopfloor study reveals. If you want help identifying where your processes are quietly costing you money, I offer a short CostDown Audit — a focused review of your shopfloor operations to uncover hidden savings and put real numbers on the opportunity.